Here we are going to take a close look at the Fund Cost Report builder, also known as the Total Cost of Ownership Report.
The Fund Cost Report builder is going to allow us to deeply understand:
- The costs associated with a specific ETF or Mutual Fund
- Other relevant information about the fund
- The projected after-cost returns for this holding compared to both a theoretical no-cost holding, as well as other lower-cost holdings in the category
There are three steps to creating this report:
- Select a fund
- Set the assumptions you’d like to use for this analysis
- Review and print the report
Home
Let’s start on the Home tab. Here we have a couple of options. We can:
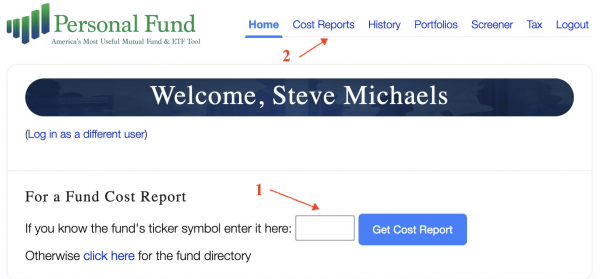
- Select a specific holding by entering its ticker symbol
- Find a holding using the Fund Directory. You can also go directly to the Fund Directory by clicking Cost Reports at the top of the screen.
Let’s start by entering in the ticker symbol of a fund we know. We’ll use American Funds Growth Portfolio Class A, which has a ticker of GWPAX. Type the ticker symbol into the box and click “Get Cost Report.”
Cost Query
Now, to run the analysis, we’ll need to provide some additional information or assumptions. However, if you just want to analyze a fund on a quick hypothetical basis, you can use the pre-populated default values on this page for your fund-costs analyses. This is often the best way to do a quick cost analysis of a given fund when you don’t have a specific investment situation in mind. When analyzing a fund for a specific investment situation (e.g. “I want to invest $25,000 in a fund for 10 years so I can use it to pay for my kids’ education”), it’s worth taking a moment to fine tune the assumptions to that situation for better results.
Also note that your most-recent assumptions will be saved for future Cost Reports, so you don’t have to enter them each time when analyzing multiple funds for the same investment situation. If you ever want to reset all of these values to the defaults, click Reset at the bottom of the screen.
Let’s assume we’re analyzing a fund for a specific situation.
-
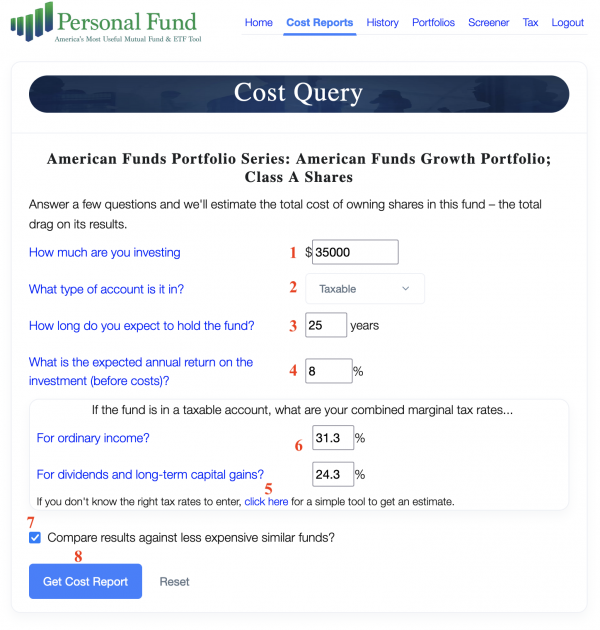
- Start by choosing an amount you wish to invest in this fund type. Let’s say $35,000.
- Next, choose the account type. Since taxes are part of the cost analysis, the type of account will impact the overall cost. Use the drop-down box to choose between Taxable and Tax-Sheltered account types. For this example, we’ll say we’re analyzing this fund as a possible holding for our taxable (brokerage) account, rather than a tax-advantaged retirement account, so let’s select Taxable.
- Choose a time horizon for how long you’d like to hold the fund. Let’s say you have a time horizon of 25 years before you’ll need to use this money, so we’ll enter 25 years here.
- Next, we need to make an assumption for Rate of Return. That is, what is annual expected rate of return for the fund’s asset class in the absence of costs? If you have growth assumptions you’d like to use for different asset classes, you may choose to use the appropriate one here. However, just try to remember to be consistent when comparing funds of the same class or category. At Personal Fund, we believe in sticking with the facts when possible and leaving other factors constant. We know the current cost structures of funds and the existing tax tables, but expected returns are less certain. So we’d encourage you for most, if not all, of your cost reports, to just stick with the default expected annual return we provide, which is based on the last few decades of returns for the selected fund’s asset class. This way, you’ll know you’re always comparing the costs of funds on an apples-to-apples basis. That said, returns WILL impact the future costs of a holding, so we want to allow you to fine-tune cost projections if you feel a different return profile would be more realistic. For this example, we use 8% for our return assumption.
- Now we need to make some assumptions for taxes. This section only impacts the projection if we’re running an analysis for a taxable account, so if you selected tax-sheltered above, you can skip this part. What we’re looking for is the marginal combined federal and state tax rates. If you are unsure of which tax rates to assume, you may quickly estimate the combined marginal rates using our Tax Estimator Tool by clicking the link. For this case, which is for a hypothetical California couple filing jointly with a taxable income of $192,000. The Tax Estimator Tool estimates that this couple has an ordinary income tax rate of 31.3% and a long-term capital gains rate of 24.3%.
- Clicking back to the main page, let’s enter these numbers in the appropriate boxes for our analysis.
- Finally, before we run our cost report, we can choose whether or not we’d like to see the results compared against less-expensive funds in the same fund category. This box is checked by default and provides more useful information in our report. You can uncheck it if you simply want to see results for this one fund, but for this example, we’ll leave it checked to include those comparison funds.
- Now let’s click “Get Cost Report.”
Navigating Your Total Cost of Ownership Report
You now have a Total Cost of Ownership Report for the fund you selected. The Personal Fund reports are designed to be self-explanatory in most cases, for the knowledgeable investor. In many sections you will find a brief description of the key concepts the section is demonstrating.
In places where it may not be totally clear what a number or category represents, we’ve hyperlinked these terms to a detailed explanation glossary you can pull up without leaving the report. Anywhere you see blue text, you can click the on it to find that detailed explanation glossary. If you have questions about terminology, methodology, or just want to go deeper, chances are those explanations are what you’re looking for.
Let’s take a high-level look at the different parts of this report, and then we’ll look at each part in more detail.
Key comparison data:
- Introductory Text – This introductory text summarizes some of your assumptions and describes this fund’s hypothetical costs over the most recent 1-year period.
- Comparison Cost Summary – This table compares your selected fund against both a hypothetical no-cost investment and against other funds in its category.
Additional fund-specific data:
- Last Year’s Itemized Costs – A detailed breakdown for the fund of costs from the last fiscal year, including distribution costs, taxes, and pro-rata transaction costs
- Estimated Future Returns and Costs – a summary of projected returns without any costs, and a projection of the costs you can expect given your assumptions.
- Basic Fund Profile – additional information about this fund
- Benchmark
- Loads
- Itemized Expense Ratio
- Other Relevant Fund Info
The introductory text first summarizes the impact of costs on your selected security over the most recent available 12-month period, based on the assumptions you selected on the previous screen.
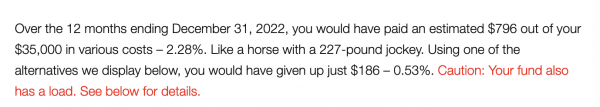
Note that these percentages are considerably higher than the funds’ expense ratios. The expense ratio is just a portion of the total costs you pay when investing in a fund. This is a primary takeaway from this exercise – that the expense ratio only tells a part of the story, and we must look at all of the fund’s associated costs to conduct a true cost comparison. Some funds may have considerably lower expense ratios than others, but will actually end up costing the investor considerably more when we take things like distributions, our pro-rata share of the funds transaction costs from holding turnover, and taxes into account.
The Comparison Cost Summary table below shows a side-by-side comparison of different investment scenarios.
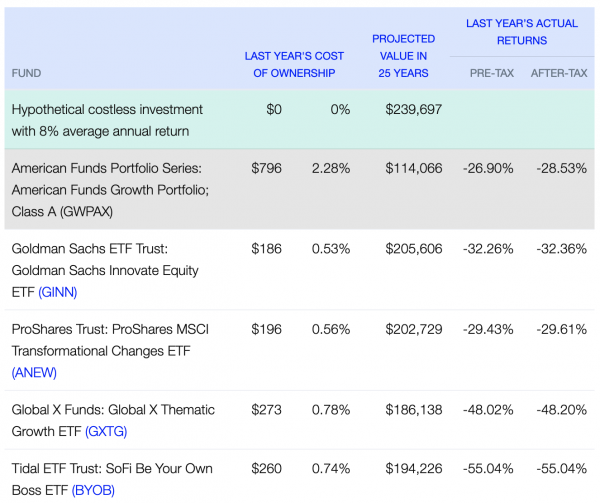
In the scenarios, all of your assumptions remain constant, and the only variable is the investment option.
Line 1 shows a hypothetical no-cost investment. Although an actual no-cost option is generally not available, this can be useful as a baseline for isolating the costs of various real-life options.
Line 2 shows the fund you selected to analyze – in our case, GWPAX. The first two columns show last year’s cost of ownership based on the latest 12-month Lipper data for the investment — first in real dollars, and then in percentage form. The next column the projected value after costs for the time horizon and growth rates you selected. Compare this to the no-cost option above. Are you surprised by the amount of value that has been lost to the costs of investing? Most investors are shocked by the difference. GWPAX has a 0.73% expense ratio. Not terrible right? Well over 25 years of investing, that expense ratio plus other investing costs would total a nearly 36% loss of potential appreciation when compared to a no-cost investment! This is why understanding all costs, not just the expense ratio, is so critical for investors. We can’t predict which funds will outperform (before costs) over a 25-year period, but we can measure the fees and other expenses with a reasonable degree of accuracy and use that information to minimize costs and retain significant value for our investments.
Lines 3+ show lower-cost alternatives funds. These alternative funds are not investment recommendations, and are not necessarily the lowest-possible cost alternatives. These are funds which have the same fund category as the one you chose, as determined by our data source Lipper. We first weed out funds with loads, then find the funds with the lowest “last-year’s cost of ownership” in the Lipper fund category for the tax rates you selected. While these may be a good starting point for selecting alternative funds, the primary purpose is to provide a comparison to some other possible investment options. (You may also use the Fund Screener tool to search for low-cost funds when trying to select specific investments).
We see that the least costly fund in this example, Goldman Sachs ETF Trust: Goldman Sachs Innovate Equity ETF (GINN) would, under the assumptions, produce a much better after-cost return losing only 14% of potential appreciation to costs over 25 years for this investor, as compared to our chosen fund losing 52%. We can see the final investment post-cost value at the end of the period for each of these investments to compare them side by side. In the last two columns, we also include the previous year’s pre-tax and after-tax returns. Just remember, while some funds do better than others from year to year, our goal here is cost mitigation, because it’s generally more predictable than performance.
Below this table, we’ll find some other useful information and links:
- A summary of the cost analysis demonstrated by the table above.
- A highlight of any load fees associated with our selected fund.
- A quick link to the “Dump This Fund?” calculator, which demonstrates the costs of switching from our chosen fund to another option.
- A quick link to begin a Cost of Ownership Report for another fund.
Following this is the Last Year’s Itemized Costs table.
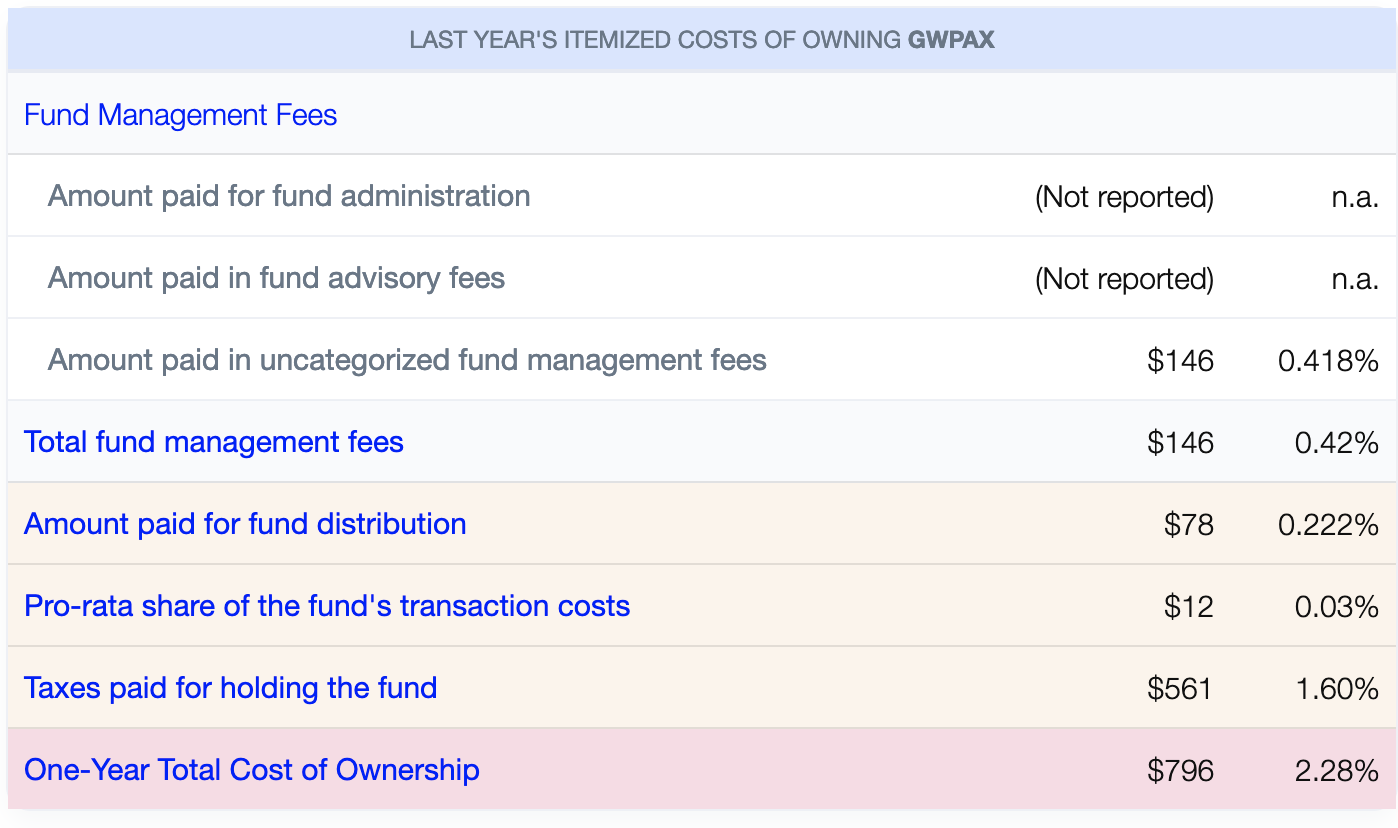
This table breaks out the various specific projected costs for investing in this fund with the assumptions you provided. The Fund Management Fees are some of the published fees for the fund. The “Amount paid for fund distribution” reflects the fund’s 12b-1 fee, if reported. The next two types of fees are either estimated or derived based on the assumptions you provided and other information we know about the fund. These fees may be less exact than the management fees above, but they are important factors in your investment cost profile. If you’d like to get into the details of how each cost factor is derived, just click on the blue hyperlinked text on the left to learn more.
Next is the Estimated Future Returns and Costs table.
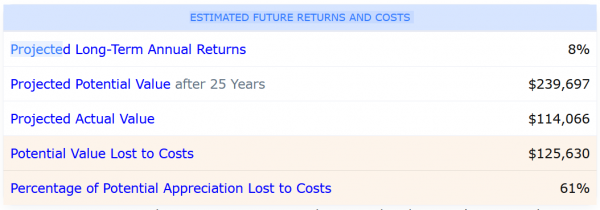
This table shows the numbers we talked about when describing the Comparison Cost Summary Report table above, including your rate of return assumption, the no-cost projected value after your assumed years of investing, the after-cost projected value of your chosen fund, and perhaps most importantly, the dollar value and percentage of appreciation lost to costs. Here again, the text below the table explains the values and costs are extrapolations of last year’s costs and taxes, and so they are rough estimates. Still, given what we know, these projections give you an idea of just how impactful the costs of your investment selections can be on your overall investment experience.
Finally, the Basic Fund Profile tables provide you with many of the go-to data points you might want to know about your chosen fund. These can be useful quick-reference when analyzing a fund and are typical data points you would see on other investment-research platforms and sites. We also provide detailed descriptions of each of these data points which you can access by clicking the hyperlinked text to the left.
This is the end of the data provided on this report. There are a few places we can go from here to continue our analysis:
- Generate a PDF report – For a more visually-succinct layout of the data from above, you may wish to generate a PDF report and save it for your records or share it with a client. (Check out a sample PDF report here). To create your PDF presentation of this Cost of Ownership Report, scroll to the top of the screen and click “Download Printable PDF” in the top right-hand corner.
- Get Fund History – Up to this point, we’ve been using the most recent 12-months of fund data to extrapolate costs going forward. If you want to dig deep into the fund’s history to learn more about its historical performance and expenses over time, use the “Get Fund History” button. You can also include the ticker of a comparison fund and use the “Get Fund History (with comparison)” button to show the funds history side by side with another fund. For a How-To Guide on using and understanding the Get Fund History tool, click here.
- Quick Fund Lookup – Enter another fund ticker or click “find” to conveniently run another Cost of Ownership Report quickly.
- Dump This Fund? – The final tool at the bottom of the page allows you to analyze the financial consequences of selling the fund you’ve been analyzing, assuming you already hold this fund, and replacing it with another investment option.