Mutual funds and Exchange-Traded Funds (ETFs) incur costs that are passed along to the fund’s shareholders, in the form of fees deducted from every share. A fund’s expense ratio indicates the percentage of an investment that a shareholder pays in fees to the fund manager. Expense ratios are crucial to investors because the fees paid can reduce the investor’s returns.
A fund’s expense ratio is determined by dividing its total annual fees by the value of its assets. Learn more about expense ratios so you can select the mutual funds and ETFs most likely to generate the highest returns.
What is a Mutual Fund Expense Ratio?
There are many costs involved in running a mutual fund or ETF – e.g., salaries, research, accounting, marketing, shareholder communications, and the manager’s profit. These costs are borne by the fund’s investors and reported as an expense ratio, or percentage of the average net assets of the fund.
A mutual fund expense ratio is sometimes expressed in basis points (abbreviated bps), where a basis point equals .01%. For example, if a fund had an average of $10 billion in assets in 2021 and paid $100 million in expenses that year, its expense ratio for 2021 would be 1%, or 100 basis points. 1% is a middle-of-the road expense ratio for many types of funds.
The expense ratio directly measures what it costs an investor to own shares of the fund. The fund’s costs are withheld as a fee from each investor’s shares of the fund, in proportion with the expense ratio. For example, if a fund invested in every stock in the S&P 500 index in the same proportions as the index, it would have gained 28.7% in 2021. If the fund charged an expense ratio of 1%, its investors would have seen the value of their shares by 28.7% – 1%, or 27.7% for the year. (The exact math is more complicated, but this is a decent approximation). An investor in a similar fund that charged a 0.2% expense ratio would have seen their shares rise 28.5%.
The fees are subtracted from the investor’s shares whether the fund is gaining or losing value. While stocks had a great year in 2021, bonds had a terrible year. The Bloomberg US Long-Term bond index lost 2.52% in 2021. An investor holding an average U.S. long-term bond fund with an expense ratio of 1% would have lost 3.52%. But a similar fund with a 0.2% expense ratio would have lost a less horrible 2.72%.
What is the Importance of a Mutual Fund’s Expense Ratio to Investors?
Nobel Prize winning economist William Sharpe was once asked in an interview how to decide which mutual fund to invest in. He answered, “The first thing to look at is the expense ratio”.
The expense ratio represents the portion of one’s investment that the investor hands over to the fund manager every year. The lower the expense ratio, the more the investor keeps. The higher the expense ratio, the more of the investor’s potential wealth goes to the fund manager. And unlike some other kinds of products, the adage “you get what you pay for” doesn’t apply to mutual funds.
A $100,000 Mercedes is probably more comfortable, safer, more reliable and has more horsepower than any $20,000 car. But you can’t expect a mutual fund with a 1% expense ratio to perform better than a comparable 0.2% expense ratio fund. The opposite is true. Many studies over the years, including the 2019 study by Personal Fund, have shown that on average, every dollar in fees that an investor pays the fund manager only decreases the investor’s wealth by a dollar.
Differences in expense ratio of less than 1% might seem minor. But the fees are deducted every year, so the total paid out grows exponentially over time. Over an investor’s lifetime, the expense ratios she pays on her funds can make a huge difference in the size of her nest egg.
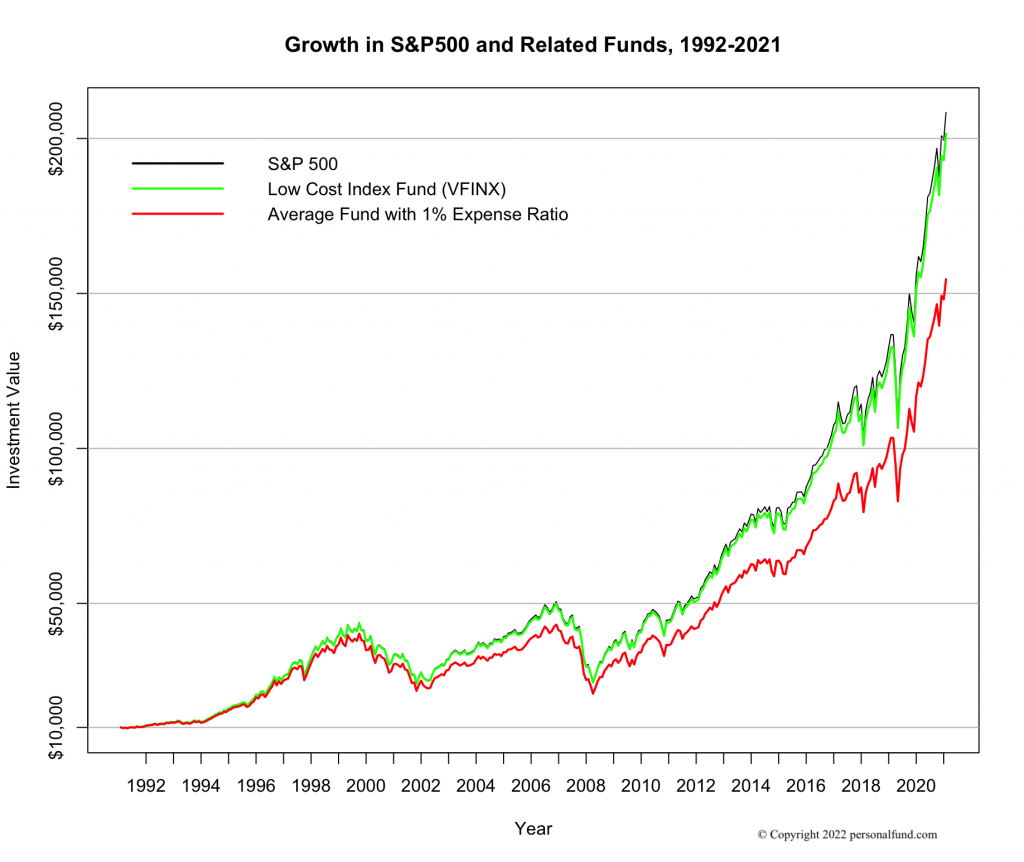
Consider this real-world scenario. The average annual return on the S&P 500 with all dividends reinvested for the 30 years ending 2021 was 10.65%. If it were possible to invest in the S&P 500 without having to pay any fees, a $10,000 investment in the S&P on January 1, 1992 would have been worth $208,400 on Dec. 31, 2021. But it wasn’t possible to invest in the index without fees. The closest investment available to an individual would have been to buy shares in a low-fee S&P 500 index fund.
One such fund, the Vanguard 500 Index Fund (VFINX), has a current expense ratio of 0.18%. A $10,000 investment in VFINX on January 1, 1992 would have been worth $201,600 at the end of 2021, or 97% of the value of the pure index. On the other hand, take a hypothetical average mutual fund, whose average return before fees would have equaled the return of the S&P 500 (a realistic assumption). If that fund charged a middling 1% expense ratio all those years, a $10,000 investment in that fund at the beginning of 1992 would be worth only $154,400 at the end of 2021. That is $47,200 or 23% less than the investment in the low-expense fund. See the following graph for an illustration.
Again, this is on average. Some high expense funds have above-average returns some years. Unfortunately, there is no proven way to predict the future’s top performing funds. Past performance doesn’t foretell future results. One year’s star performers often go on to lie with the dogs, and may even go out of business within a few years. A number of studies have shown, however, that selecting low expense funds substantially improves one’s chances of success. Low expense funds have higher average returns than high expense funds of the same type. Low expense funds are more likely than their high expense peers to have above average performance, and less likely to have bottom tier performance.
What Is a Typical Mutual Fund Expense Ratio?
Among all mutual funds and ETFs in our Lipper database of over 27,000 current funds, the median expense ratio is 0.80%. The 90th percentile of expense ratios is 1.65%, that is to say 90% of all funds have an expense ratio of 1.65% or less. At the top of the menu, nine funds have expense ratios of 4% or higher. The costliest fund has a stratospheric expense ratio of 7.09% (We double-checked. That is not a data error).
And for bargain hunters, there are 15 funds with a 0% expense ratio. (How can a fund company make money by running a fund without collecting any fees, you might wonder? Mainly for marketing purposes as a loss leader, to entice you to invest in their more profitable funds as well. They also collect interest from lending their securities to short sellers).
The range of expense ratio that you are likely to pay in practice depends on many factors, including:
- The type of assets the fund invests in, e.g. U.S. or foreign stocks or bonds, money market or commodities.
- Whether the fund is actively managed, and picks securities to try to outperform the market, or is passively managed and tracks a market index.
- How the fund is distributed – whether sold directly to the public through brokers or by the fund company itself, or, say, exclusively available through investment advisors.
- Whether the fund is no-load, or has a front-end or back-end load
- The fund’s minimum investment amount
- Whether it is a traditional (open-end) fund or ETF.
In general, funds that invest overseas have higher fees than funds that invest only in the US, index funds have lower fees than actively managed funds, and ETFs have lower fees than open-end funds. Index ETFs generally have the lowest fees of their asset class.
Expense ratios vary greatly even among similar funds. Below are representative ranges of expense ratios for some types of funds. (In all cases, the ranges are for no-load funds available to the general public through brokers, and excluding the handful of funds with a 0% expense ratio).
| Fund Type | Least costly 90% of funds |
| U.S. stock funds (actively managed) | 0.15% – 1.40% |
| U.S. stock funds (index) | 0.02% – 1.69% |
| Money market funds | 0.05% – 0.26% |
| U.S. bond funds (index and active) | 0.03% – 0.95% |
| Foreign stock funds (index and active) | 0.04% – 1.50% |
| Index ETFs (all asset classes) | 0.01% – 0.75% |
Given the importance of expense ratio to an investor’s prospects, and the wide range of expenses among funds in the marketplace, it’s best to shop around. Once you decide on the type of assets you wish to invest in, look at the lower cost funds of that asset class.
Online brokers have fund screening tools that can identify funds based on a number of criteria, including expense ratio. Also, Personal Fund’s Low Cost Fund Screener will help you instantly find the lowest cost funds for any asset type. Unlike other fund screeners, it also considers the other key components of fund costs in addition to expense – taxes and trading costs — to help you find the lowest cost funds, which offer the best chances for successful investing.
Mutual funds and ETFs come with more costs than show up in their expense ratio
In addition to the fees that are reported in the expense ratio, there are other costs of owning mutual funds that you should pay attention to:
- Trading costs, which the fund incurs when the manager buys and sells securities for the fund’s portfolio. These also reduce an investor’s potential returns, but are not reflected in the expense ratio.
- For investors holding their funds in a taxable account (outside of tax-deferred accounts, such as IRA, Roth, 401(k) or 529), the taxes paid on distributions from the fund also eat into one’s nest egg.
Personal Fund’s tools will help you get a handle on all of these costs for funds that you own, advise on or are considering investing in, and can help you find the funds with the lowest combination of costs for you or your client’s personal situation.
Personal Fund is America’s Most Useful Mutual Fund & ETF Tool
Personal Fund subscribers have access to the most credible, accurate and actionable information for understanding and controlling fund costs. Individual investors can use our tools to find the funds that give them the best chances of success. Investment advisors use them as a best practice in advising their clients. Our easy-to-use tools include the following:
- Fund screener, which displays the lowest-cost funds and ETFs for selected asset class and personal tax situation.
- Comprehensive costs reports that break down the fees, trading costs and taxes of owning any ETF or mutual fund, and estimate the long-term impact of those costs on future returns.
- Fund history, which illustrates a fund’s past costs, taxes and returns.
- Portfolio Analyzer, which provides an aggregated report on taxes and costs of an entire portfolio of ETFs and mutual funds
- Investment tax estimator, which estimates an individual’s combined (federal + state) marginal tax rates for investment income