What is a fund’s Turnover Ratio and why is it important to investors?
All mutual funds and ETFs report their Turnover Ratio (or simply, Turnover) which is a measure of trading activity in the fund’s portfolio. Turnover Ratio is an important number for a fund investor to understand and take note of. Especially with stock funds, low Turnover funds are more likely to deliver satisfactory performance than high Turnover funds.
Table of Contents
- Definition of Turnover Ratio
- What is a typical Turnover Ratio?
- What can a fund’s Turnover Ratio tell us about its expected performance?
- Conclusion
- Personal Fund will help you control Turnover and other fund costs
Definition of Turnover Ratio
The formula for calculating a fund’s annual Turnover Ratio is defined by the Securities and Exchange Commission to be the lesser dollar value of the fund’s total purchases or total sales divided by the average dollar value of the fund’s portfolio in the given year. If a fund with, say, an average portfolio value of $10 billion in 2021 bought $7 billion of portfolio securities and sold $6 billion worth that year, it would have a Turnover Ratio of $6 billion / $10 billion = 60%. Roughly speaking, a Turnover Ratio of 100% is consistent with the fund replacing its entire portfolio in the year, holding the average portfolio security for 1 year; 50% corresponds with a fund replacing half of its portfolio in the year, holding the average security for 2 years; and 200% is compatible with a fund replacing its entire portfolio twice in the year, holding the average security for six months.
The qualification of lesser of purchases and sales is important, as it distinguishes the fund portfolio’s trading activity from investors’ investments and redemptions of the fund itself. Returning to the hypothetical fund above, which purchased $7 billion of securities in the past year while selling $6 billion, the $1 billion of purchases in excess of sales would correspond with a $1 billion inflow of new investments in the fund net of redemptions. Similarly an excess of sales over purchases would correspond with outflows of investors redeeming their shares net of new investments in the fund.
What is a typical Turnover Ratio?
The range of fund Turnover Ratios is wide. Over 200 funds in the Refinitiv Lipper database were comfortably “buy and hold” in their last fiscal year, reporting 0% Turnover. The fund with the highest current Turnover, Vesper U.S. Large Cap Short-Term Reversal Strategy ETF (UTRN) clocks in at a dizzying 4,280%, holding its stocks only 8 days on average.
The median Turnover across all current funds in the database is 39%. But it is more informative to describe typical Turnover by fund type, as management of different types of portfolios demands different levels of trading activity. For example, the median Turnover for actively managed short-term bond funds is 68%, while that of S&P 500 index funds is 5%. As a general rule for stock funds, but not necessarily for bond funds, those funds with lower Turnover for their category tend to perform better than their peer funds with higher Turnover.
The table shows the current Turnover ranges for several classes of funds. The N column indicates the number of funds. The 10%, 50% and 90% columns are the respective Turnover percentile for each group.
| Asset Class | Type | N | 10% | 50% | 90% |
|---|---|---|---|---|---|
| US Large-Cap Stock | Active | 488 | 10 | 31 | 97 |
| Index | 85 | 3 | 6 | 57 | |
| US Mid-Cap Stock | Active | 265 | 15 | 50 | 113 |
| Index | 24 | 14 | 21 | 54 | |
| US Small-Cap Stock | Active | 559 | 21 | 56 | 132 |
| Index | 46 | 19 | 36 | 454 | |
| International Stock | Active | 621 | 14 | 44 | 107 |
| Index | 132 | 4 | 10 | 31 | |
| Emerging Market Stock | Active | 287 | 20 | 52 | 128 |
| Index | 87 | 10 | 22 | 55 | |
| US Corporate and Broad Market Bond | Active | 339 | 26 | 78 | 265 |
| Index | 64 | 5 | 29 | 145 | |
| US Government Bond | Active | 69 | 14 | 139 | 446 |
| Index | 38 | 10 | 49 | 147 | |
| Municipal Bond | Active | 428 | 6 | 18 | 47 |
| Index | 27 | 0 | 5 | 10 |
What can a fund’s Turnover Ratio tell us about its expected performance?
Research reveals that high Turnover Ratios are associated with worse fund performance than low Turnover Ratios, in the following three ways:
- High Turnover funds have lower returns.
- High Turnover funds have worse tax consequences.
- High Turnover funds go out of business more often.
High Turnover Funds Have Lower Returns
Since Turnover is a measure of the fund’s trading activity, it is a proxy for the fund’s trading costs, which ultimately reduce the fund’s returns.
The main costs of trading come from the bid/ask spread and market impact. For every trade, it costs the purchasing investor slightly more to buy a share of stock or a bond than the selling investor pockets by selling it. The difference is known as the bid/ask spread, which is captured as compensation by the market makers, such as the traders on the floor of the New York Stock Exchange. Additionally, since security prices are determined by supply and demand, when a fund enters a large purchase order for a stock it will drive up the price while large sell orders drive down the price. Although fund managers aim to increase returns net of their trading costs, on average they do not achieve that goal. Funds which trade more frequently than their peers return less to their investors, on average, than do the funds that trade less frequently.
The costs of trading are not reflected in the fund’s expense ratio, nor are they otherwise transparently disclosed. They are simply a drag on the fund’s returns. Although we can’t know a fund’s trading costs precisely, we can estimate them as a function of the Turnover Ratio.
Personal Fund’s research study on fund costs and returns found that each 100% increase in Turnover Ratio was associated with the following average decreases in annual return, depending on fund type.
| Fund Type | Average decrease in annual return per 100% increase in Turnover |
|---|---|
| US Large-Cap Stock Funds | 0.41% |
| US Small- and Mid-Cap Stock Funds | 0.53% |
| International Stock Funds | 0.87% |
We did not find a statistically significant relationship between Turnover Ratio and returns among bond funds.
High Turnover Funds Have Worse Tax Consequences
Stock funds that trade more frequently tend to generate higher net capital gains, which they return to investors in the form of taxable distributions. This would not be a concern to investors who hold the funds in a tax-advantaged account, such as a IRA, 401(k), or 529. But high Turnover funds held in taxable accounts impose higher tax obligations than low Turnover funds.
We can view a fund’s capital gains tax efficiency for a given year as the portion of a fund’s total value which is returned to the investor that year in the form of capital gains distributions. The remainder of the fund’s total value would either be retained in the fund’s Net Asset Value (share price) or returned in the form of dividend distributions. Dividend distributions are also taxable for most fund types. But the level of dividends is more a function of the variety of assets the fund invests in, not its trading behavior. For this discussion we are specifically interested on the connection between Turnover Ratio and taxable capital gains distributions. The lower the portion that is returned as capital gains distributions, the more tax efficient.
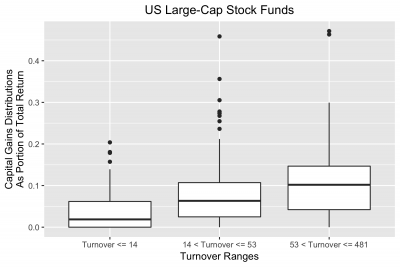
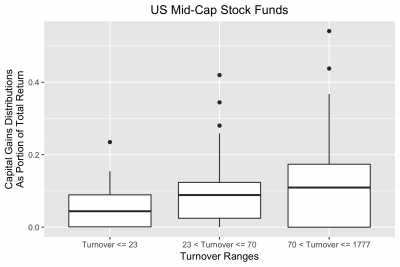
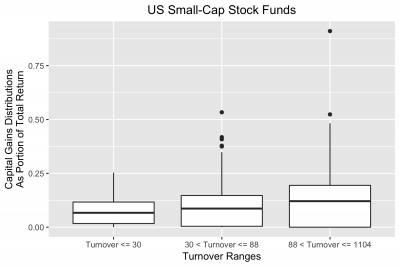
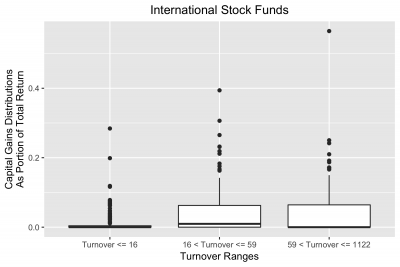
The “box and whisker” plots below illustrate the tax consequences of various classes of stock funds in 2021. For each class, the three boxes represent the lower 25%, middle 50% and upper 25% of funds by Turnover. The simple visual interpretation is that the taller the box, its “whisker” and dots above, the greater the number of funds in the group with high capital gains distributions. For example, among Large Cap US stock funds, the low Turnover group has a median capital gains portion of 2% while the high Turnover group has a median capital gains portion of 10%. For the low Turnover group, the worst ¼ of the funds have capital gains portion between 6% and 20%, while the worst ¼ of the high Turnover funds have capital gains portion between 15% and 47%.
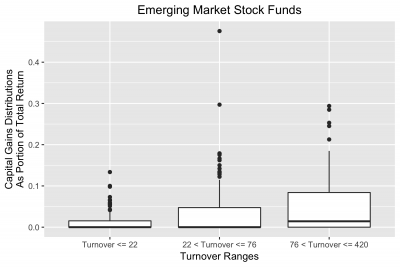
We show plots only for stock funds, not for bond funds. Bond funds deliver most of their returns as dividend distributions of bond interest. Capital gains distributions from bond funds tend to be very low, and the relationship between Turnover and capital gains distributions for bond funds is not significant.
High Turnover Funds Go Out of Business More Often
It is not uncommon for funds to go out of business, in which case one of two things can happen: Either the fund is liquidated and investors receive cash equal to the underlying asset value of their shares. Alternatively, the defunct fund may be merged into another fund, and shares in the old fund are exchanged tax-free for shares of equivalent dollar value in the new fund. Neither outcome is particularly desirable. In the liquidation scenario, the investor holding the fund in a taxable account would be liable for capital gains tax as if he cashed in the fund voluntarily, along with tax on the fund’s undistributed capital gains. In the event of a merger, the investor is left with shares in a fund that he did not choose, and which may invest in a different asset class, or with a different strategy from what the investor would choose – and possibly with higher fees, higher Turnover and/or lower tax efficiency.
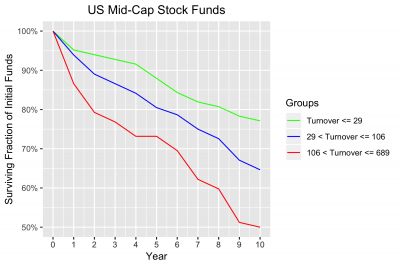
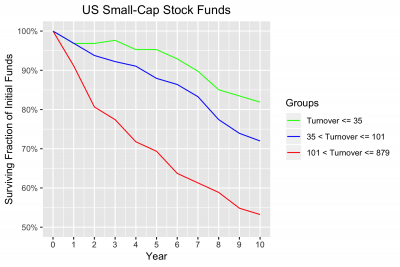
The graphs show, for each class of funds, the rates at which the funds went out of business over time. We look at all funds of the class that were on the market at the end of 2011, divide them into groups by Turnover at that date (lowest 25%, middle 50% and highest 25%) and count how many funds of each group were still in business at the end of each of the next ten years, until the end of 2021. The plot shows the percentage of each group that was still in business. Green for the low Turnover funds, Red for the high Turnover funds, Blue for the middle group. For example, we see that among US Large-Cap Stock funds, 71% of 2011’s low Turnover funds were still in business at the end of 2021, while among the middle and high Turnover funds respectively, only 63% and 54% were still around.
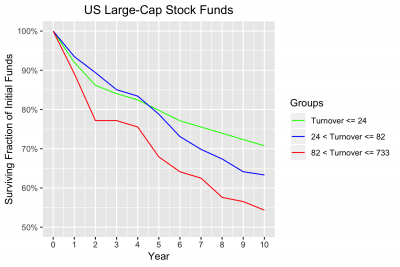
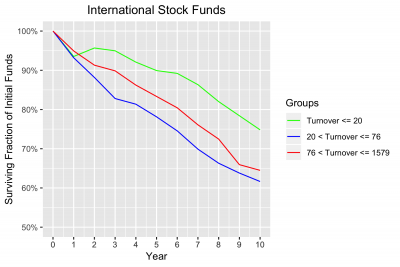
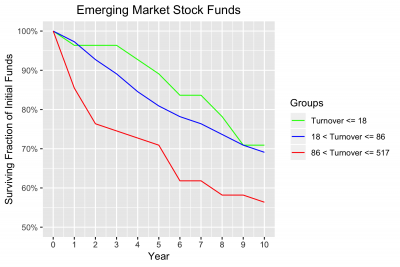
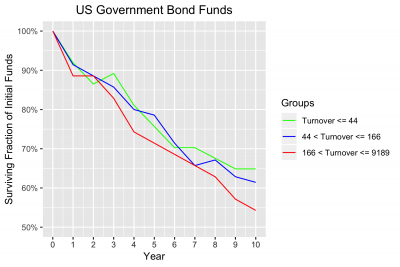
Again, the relationship between high Turnover and early demise is noticeable among the classes of stock funds that we looked at. The relationship does not appear to hold for every class of bond fund. Although it did hold for US Government Bond funds.
Conclusion
In summary, although Turnover Ratio is not an exact predictor of fund performance, for stock funds it is a useful indicator of a fund’s prospects. We showed that on average, higher Turnover stock funds have lower returns, worse tax consequences and greater chances of going out of business than do low Turnover funds. As we write in our article about mutual fund and ETF expense ratios, before you invest in a fund, the first thing you should look at is the expense ratio. The second thing you should look at in a stock fund is the Turnover Ratio. Sticking with low Turnover funds will improve your odds of success and reduce your chances of disappointment.
Personal Fund will help you control Turnover and other fund costs
Personal Fund’s tools will help you get a handle on Turnover and other costs for the funds that you own, advise on or are considering investing in, and can help you find the funds with the lowest combination of costs for you or your client’s personal situation.
Personal Fund subscribers have access to the most credible, accurate and actionable information for understanding and controlling fund costs. Individual investors can use our tools to find the funds that give them the best chances of success. Investment advisors use them as a best practice in advising their clients. Our easy-to-use tools include the following:
- Fund screener, which displays the lowest-cost funds and ETFs for selected asset class and personal tax situation.
- Comprehensive costs reports that break down the fees, trading costs and taxes of owning any ETF or mutual fund, and estimate the long-term impact of those costs on future returns.
- Fund history, which illustrates a fund’s past costs, taxes and returns.
- Portfolio Analyzer, which provides an aggregated report on taxes and costs of an entire portfolio of ETFs and mutual funds
- Investment tax estimator, which estimates an individual’s combined (federal + state) marginal tax rates for investment income