About the Portfolio Analyzer
The Personal Fund Portfolio Analyzer enables you to perform an aggregated cost analysis of an entire fund portfolio using the same algorithms and same up-to-date fund data as are used for the familiar cost analysis of a single fund.
How to use the Portfolio Analyzer
Visit https://personalfund.com/portfolios/
You will be prompted to login to the site if you are not logged in already, and prompted to subscribe if not yet a paid subscriber.
When you visit the Portfolio Analyzer for the first time, your screen will look like this:
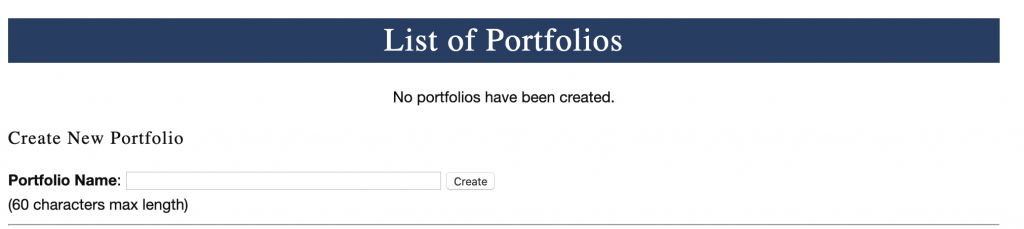
To create a new portfolio, enter the name by which you wish to refer to the portfolio, perhaps the name of the client, e.g. Smith Family or Richard Jones.
Once you click the “Create” button, you will be taken to a screen to enter more details about the portfolio, which looks like this:
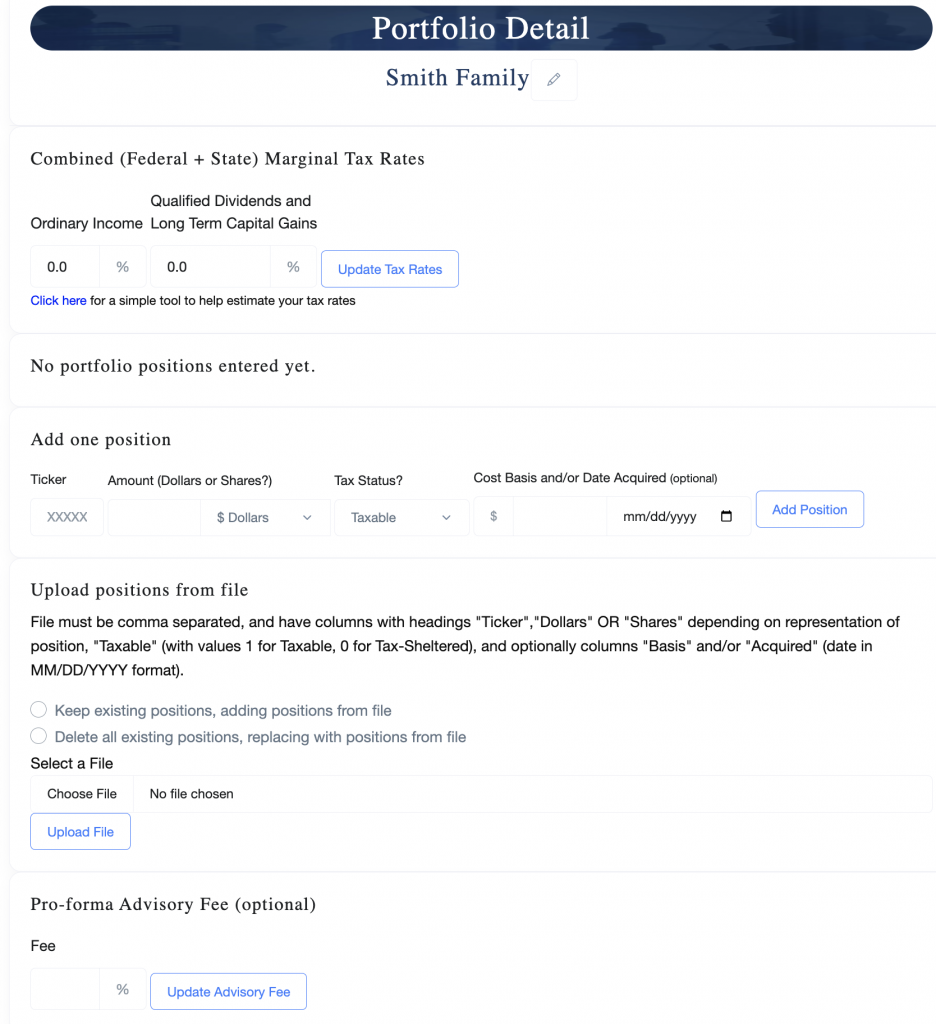
You can change the name of the portfolio by clicking on the pencil icon next to the name.
Next you may enter your best estimates of the combined (federal+state) marginal tax rates that apply to the portfolio, then click the “Update Tax Rates” button. If the portfolio consists of tax-sheltered accounts only, then it is not necessary to enter the tax rates.
At the bottom you may optionally enter a number to estimate the annual fee (percentage of AUM) paid to the financial advisor who manages the client’s portfolio. If you are analyzing a prospect’s portfolio that is managed by another advisor, enter that advisor’s fee. If you are analyzing a portfolio that you manage or propose to manage, enter your fee. If this field is filled in, the fee estimate will be presented as a line item in the total cost of portfolio management and advice in the portfolio report. If the field is left blank it will not be included in the report.
Entering portfolio positions
Portfolio positions may be entered in either of two ways.
- Typing each position individually on the web page
- Uploading a CSV file containing one or more positions
To enter a single position on the web page, scroll down on the page to where it says “Add One Position” and enter the following:
- The ticker symbol of the asset (at this time only ETFs and open-end mutual funds, including money market funds, may be entered)
- Either the number of actual shares of the asset in the portfolio (including up to four places after the decimal) -OR- a dollar amount. You must indicate by clicking the button whether the amount is in dollars or shares. If a dollar amount is entered, the position will be converted into shares at the most recent share price in the system (typically the closing price at the previous trading day).
- Click to indicate whether the position is held in a taxable or a tax-sheltered account. It is possible to enter both taxable and tax-sheltered positions for a given asset. The cost analyzer will report the estimate tax cost for the taxable position only.
- You may optionally enter the cost basis and acquisition date of the position. Indeed, you may enter multiple tax lots for a given asset. (The cost basis and acquisition date information is not used in the first version of the Portfolio Analyzer, but that facility is there to store that information so it can be used in future tools to estimate the tax consequences of selling a taxable position).
To upload a CSV file containing one or more positions, scroll down to where it says “Upload positions from a file”. The file must be comma-separated. Other Excel type file formats cannot be uploaded in the initial version. Each row of the file would represent one position. The file must have the following columns, with the given names:
- Ticker the ticker symbol of the asset
- Either Shares or Dollars, depending on how the size of each position is expressed, as above. If you enter the amount in Dollars, the number of shares held will be estimated from the most recent NAV prices (typically from previous day’s closing price).
- Taxable, with a value of 1 to indicate a taxable position, 0 to indicate a tax-sheltered position.
- The file may optionally include columns Basis and Acquired. As when entering one position at a time on the web page, the file may contain multiple tax lots for a given asset, one row per lot; and may contain rows indicating both taxable and tax-sheltered positions for a given asset.
i.e the file should look something like this:
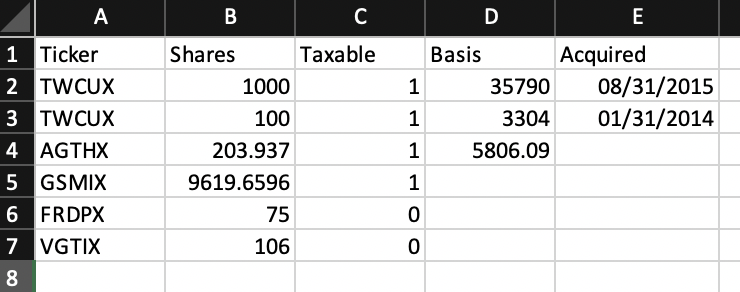
If you create the file in Excel, be sure to save it as type “Comma Separated Values”, NOT as type “CSV UTF-8”. A file of the latter type cannot be read and will produce the error “No ‘Ticker’ column in the file”.
Before uploading the file, you must click to indicate whether the positions in the file should be added to the portfolio, without deleting any positions that are already in the portfolio, OR whether the positions in the file should entirely replace any positions already in the portfolio (I.e. positions currently in the portfolio will be deleted before the uploaded positions are stored). If no positions have previously been entered into the portfolio, this choice is not material. Click on the “Choose File” button to select a file from your computer drive, and then “Upload” to upload the file.
Once a portfolio has been populated with positions, the screen will look something like this:
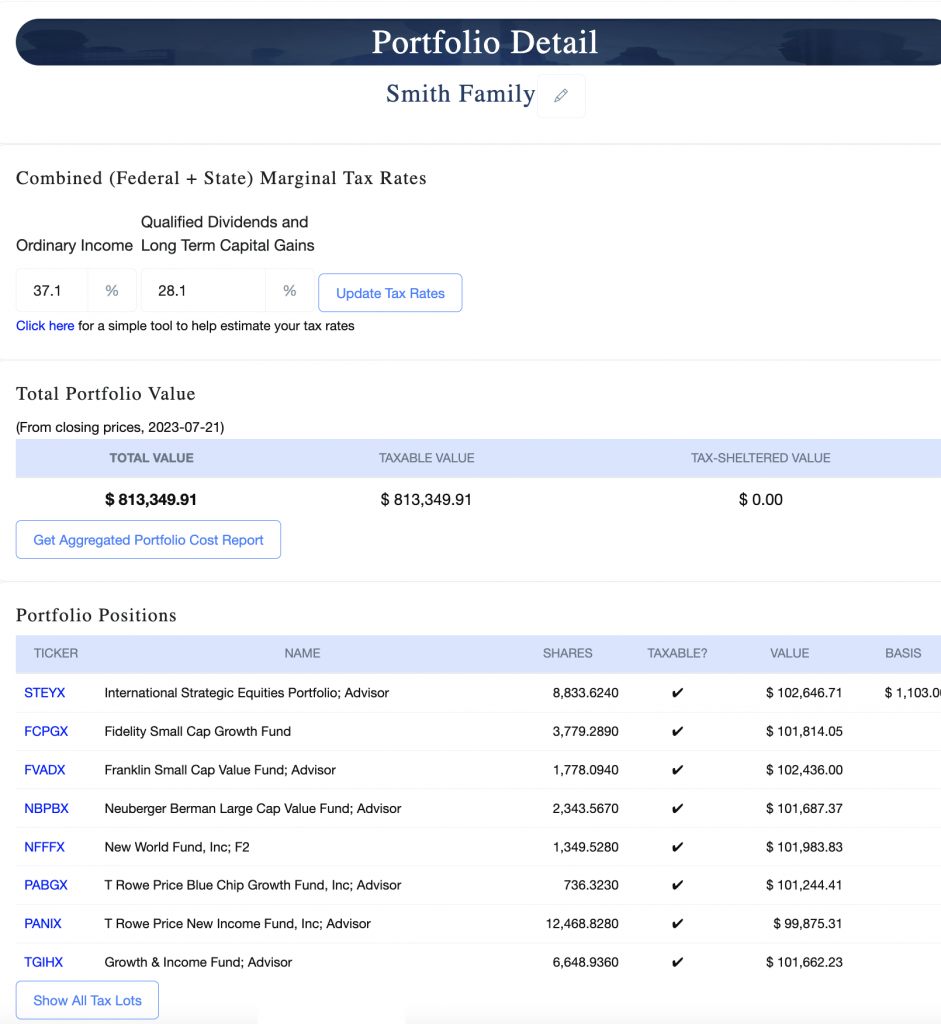
The fund ticker symbols are live links. Click on a ticker symbol, and a complete Cost of Ownership report will be generated (in a new browser tab) for the given holding with applicable dollar value and tax status and rates.
There are a few elements on the screen that were neither present nor applicable to an empty portfolio. Top to bottom:
Just above the “Portfolio Positions” table, clicking the “Review Portfolio Costs” button will produce the cost analysis report for the entire portfolio. (An explanation of that page, below). The computation may take a few seconds to complete.
At the bottom of the “Portfolio Positions” table is the “Show Tax Lots” button. Clicking on this button will switch from displaying the summary positions as shown above to listing all tax lots for every position. This screen shot shows what that the Portfolio Positions table in tax lots mode looks like.
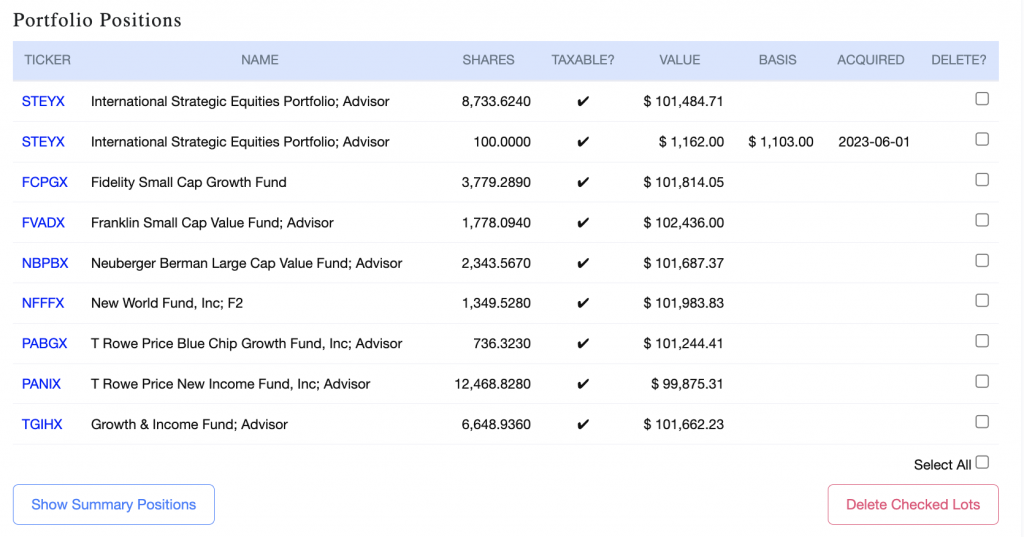
Here you can check boxes to mark individual lots for deletion from the portfolio, and click on the “Delete Checked Lots” button at bottom to effect their deletion. Clicking on the “Show Summary Positions” button will switch back to the summary table as in the previous screen shot.
Clicking the “Review Portfolio Costs” button (just above the Portfolio Positions table) will produce a report that looks like this:
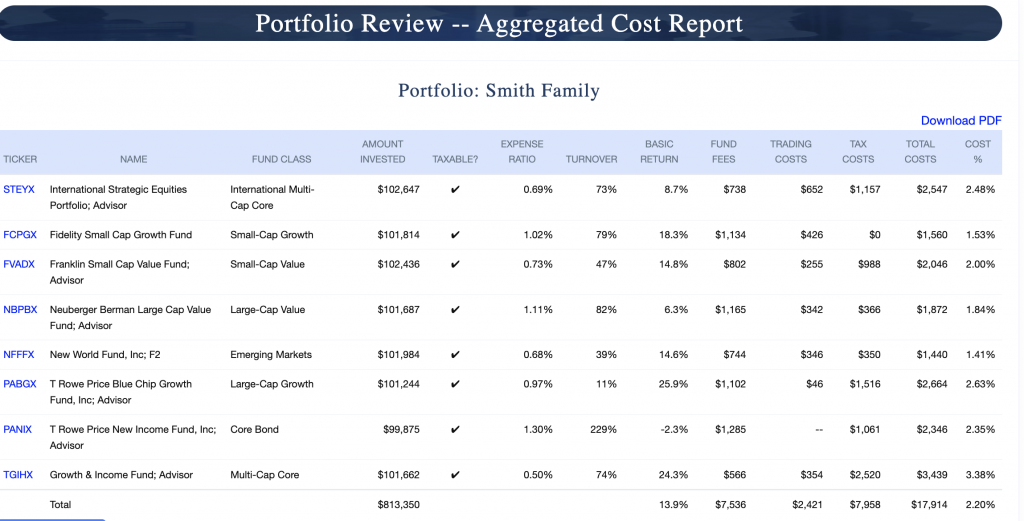
The values in the column are computed as are the corresponding fields in the familiar Personal Fund cost analysis for a single mutual fund. The calculations assume that the “Amount Invested” was invested in the fund 12 months prior to the date of this report, and that the tax rates specified for the portfolio apply to the taxable funds. The “Basic Return %” and “Cost %” figures in the bottom “TOTAL” row are weighted by the value in each position. As with the portfolio listing on the “Portfolio Details” page, clicking on each fund ticker symbol will generate a complete Cost of Ownership report for the given holding.
Clicking on the “Download PDF” link in the upper right will generate a PDF report suitable for printing and presentation to clients. Its format is slightly different from this page. A sample report is here. Not that if you entered an estimated advisory fee, it will be shown in the PDF report, but not on this page.
Clicking on the “Return to the list of all of your portfolios” link below the table will take you to back to the main Portfolio page, which, now that we have created a portfolio looks like this
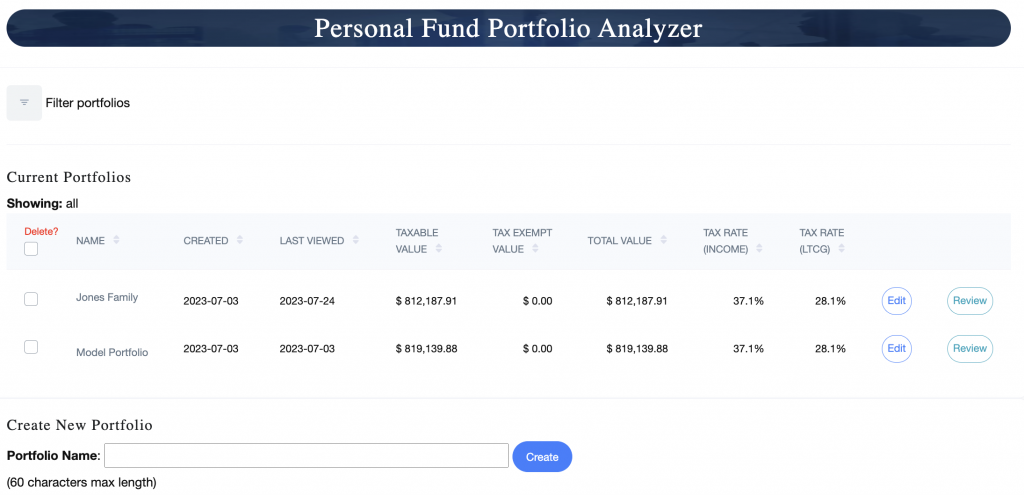
You may click on the “Filter portfolios” at upper left to limit the display to portfolios whose names match a search string, or whose creation dates fall within a specified range. You may click on the column headings to sort the list by that column in either ascending or descending order.
Notice that each row in this table has two buttons on the right end. The “Edit” button will take you to the “Portfolio Details” page where you can edit the tax rates or add positions to, or remove from the portfolio. The “Review” button performs the cost report in the previous screen shot.
If you wish to delete any portfolios, you may select the checkbox to the left of the name of each portfolio that you wish to delete. Or check the box in the heading row to select all portfolios. If any portfolios are selected a trashcan “Delete” icon will appear at top. Clicking it will delete the selected portfolios. CAUTION: this operation is permanent and irreversible.
You can create additional portfolios as shown at the top of this article.
We invite your feedback. Please let us know how well the Portfolio Analyzer addresses your needs, and please offer suggestions for updates and improvements. What additional information, if any, would you like to see in the reports? What additional questions, if any, would you like the analyzer to help answer for you now that portfolios can be entered and stored? Any and all of your comments are important to us.
Please contact us at support@personalfund.com with any bug reports, questions, comments or suggestions.
Updated 2023-07-24